Windy
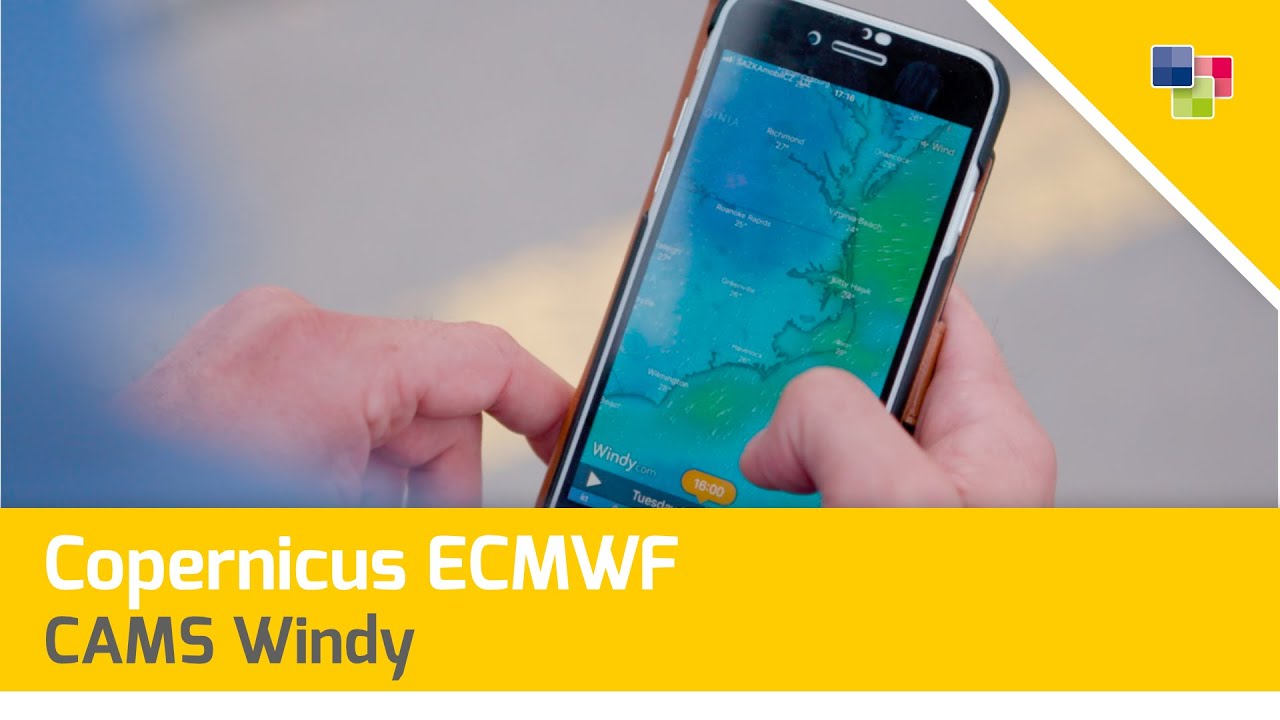
Editorial and science-communication work supporting ECMWF and the Copernicus Atmosphere Monitoring Service in explaining how weather and atmospheric data can be made accessible through Windy, a widely used visual weather platform.
Overview
Windy was a communications project connected to the European Centre for Medium-Range Weather Forecasts (ECMWF), the Copernicus programme and the use of interactive visualisation to make environmental data easier to understand.
The work focused on explaining how complex forecast and monitoring data can be made useful to non-specialist audiences through familiar, map-based interfaces. Windy presents changing weather and environmental conditions as an interactive global visualisation, allowing users to explore variables such as wind, rain, cloud, temperature and air quality.
I contributed editorial and science-communication work through Design & Data, supporting clear public storytelling around atmospheric data, Copernicus services and the practical value of environmental information.
Context
Weather and atmospheric information is technically complex. Forecasting systems combine physics-based models with observations from satellites, weather stations, aircraft, ships, balloons and other instruments.
For public audiences, the usefulness of this information depends not only on scientific quality but on whether it can be understood and applied. Interactive maps offer a practical way to show changing conditions across time and place.
Windy is a weather-visualisation service that displays a range of forecast layers over an interactive global map. It uses ECMWF weather information alongside other sources to present variables including wind, rain, lightning and cloud types. [web:219][web:226]
The challenge
The communications challenge was to connect three different levels of the story:
- Scientific infrastructure: ECMWF forecasting and Copernicus monitoring systems.
- Environmental information: weather, atmospheric composition, air quality and aerosol forecasts.
- Public value: a visual interface through which people can explore conditions relevant to daily life, travel, safety and environmental awareness.
This required translating terms such as atmospheric composition, particulate matter, nitrogen dioxide, numerical modelling and forecast layers into clear, practical language without overstating certainty or simplifying away the underlying science.
CAMS and ECMWF
The Copernicus Atmosphere Monitoring Service (CAMS) provides information about atmospheric composition, including air pollutants, aerosols and other components that affect air quality, climate and human health.
ECMWF implements CAMS on behalf of the European Union as part of the Copernicus Earth-observation programme. [web:227][web:221]
CAMS combines atmospheric models with satellite and in-situ observations to produce daily analyses and forecasts of atmospheric composition. Its data can support work on air quality, dust transport, wildfire smoke, volcanic ash, solar energy and climate-related environmental monitoring. [web:226][web:228]
Windy partnership
In 2019, CAMS partnered with Windy to bring global air-quality information to the Windy web and smartphone platform.
The integration included forecasts for:
- Nitrogen dioxide.
- Fine particulate matter.
- Wind-blown dust.
- Sea salt aerosol.
- Volcanic ash.
- Biomass-burning pollution and smoke.
CAMS supplied daily forecasts, while Windy made the information accessible through its visual map interface. Copernicus reported that Windy served around 800,000 users per day at the time the partnership was announced. [web:219]
My role
I worked as an Editor and science communicator through Design & Data.
My contribution supported editorial development and public-facing communication around ECMWF, Copernicus and environmental-data visualisation. The work focused on presenting atmospheric science in a way that retained technical credibility while remaining useful to audiences outside specialist forecasting, meteorological and Earth-observation communities.
This included helping shape narratives around:
- The relationship between weather forecasts and atmospheric monitoring.
- The role of ECMWF in producing and providing environmental information.
- The value of Copernicus services for public understanding and decision-making.
- How interactive visualisation can make large environmental datasets more approachable.
- The practical relevance of air-quality forecasts and atmospheric monitoring.
Editorial approach
The communication approach was based on a simple principle:
Environmental data becomes more useful when people can see where it applies, understand what it means and explore how it changes over time.
The project used map-based visualisation as the bridge between complex forecasting infrastructure and everyday interpretation.
This approach helped frame atmospheric data not as an abstract technical resource, but as information that can support decisions about health, travel, outdoor activity, aviation, emergency response and environmental awareness.
Outcomes
The work contributed to communications around the use of Copernicus and ECMWF data in public-facing weather and environmental visualisation.
Key outcomes included:
- Clearer storytelling around atmospheric forecast data.
- Public-facing explanation of CAMS air-quality information.
- Support for communications linking ECMWF, Copernicus and Windy.
- Editorial framing of interactive environmental-data visualisation.
- Video and multimedia material associated with the project.
Related media
Related work
This project is connected to wider communications work for ECMWF and the Copernicus programme, including editorial and visual storytelling around climate services, atmospheric monitoring and environmental data.
See also:
Limitations
This project concerned editorial communication and public understanding of environmental information. It did not involve producing ECMWF forecast models, operating Copernicus services or developing the Windy platform itself.
Forecast and monitoring products remain subject to uncertainty, spatial resolution limits, data availability and the interpretation constraints associated with any environmental model. Public communication should therefore help audiences understand both the value and the limits of forecast information.
Keywords
ECMWF; Copernicus; CAMS; C3S; Windy; air quality; atmospheric composition; weather forecasting; environmental data; Earth observation; science communication; editorial strategy.