BreezoMeter — Information on Air Quality and Pollen
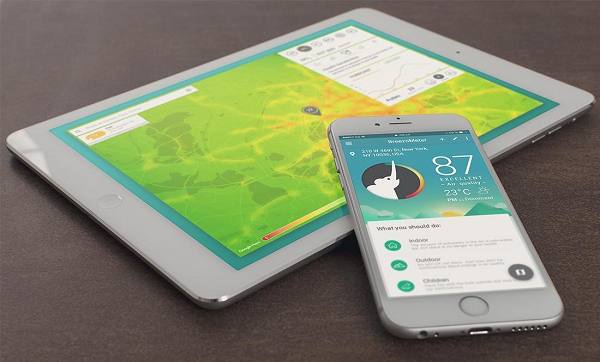
Editorial and science-communication work for BreezoMeter, a personalised environmental-information service that combines big data, machine learning, monitoring observations and Copernicus Atmosphere Monitoring Service data to provide local air-quality and pollen information worldwide.
Overview
BreezoMeter is a global environmental-information service that provides local, personalised information about air quality and pollen.
The service combines big-data methods and machine learning with multiple environmental data sources, including government monitoring stations, traffic information, meteorological conditions and data from the Copernicus Atmosphere Monitoring Service (CAMS). [web:266][web:267]
This project formed part of the European State of the Climate 2017 showcase work for ECMWF and Copernicus. I contributed editorial and science-communication work through Design & Data, helping explain how large-scale atmospheric data can become clear, useful information for individuals and organisations.
The challenge
Air pollution and pollen are often invisible, variable and highly local.
People may know that poor air quality or high pollen levels can affect health, comfort and daily routines, but they do not necessarily have the time or technical knowledge to interpret pollutant concentrations, monitoring networks, weather models or forecast uncertainty.
The communications challenge was to explain a sophisticated data pipeline in terms of everyday questions:
- What is the air quality where I am?
- Which pollutant is likely to matter most today?
- Are pollen conditions likely to affect allergies?
- When is a better time to exercise, commute or spend time outdoors?
- How can a service provide useful information where monitoring stations are sparse or absent?
BreezoMeter’s public value came from making these questions easier to answer.
The service
BreezoMeter’s aim was to provide air-quality and pollen information in a form that users could understand as readily as a weather forecast.
The service reached both businesses and consumers through:
- A mobile application.
- An interactive website.
- Application programming interfaces (APIs).
- Data products for external platforms and organisations.
Users could explore current air-pollution and pollen conditions for a selected location, alongside forecast information and personalised recommendations. [web:266][web:263]
Data approach
BreezoMeter combined several data layers to estimate local environmental conditions:
Government monitoring stations
- Satellite observations
- Traffic information
- Weather and meteorological conditions
- CAMS atmospheric data
- Machine learning and big-data analytics = Local air-quality and pollen information